This page gives some information about how the temple is doing financially. It currently shows the financial position as of the end of August 2021.
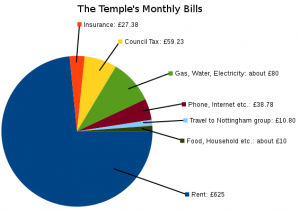
First of all, there is a summary of the costs the temple has to cover each month in order to be able to keep going.
The temple's current financial position is presented visually in different ways:
- Core Income: the basis of the temple's financial support
Looking at this in detail is a good way to assess the ongoing health of the temple's finances. - Comparison of Core Incomings and Core Outgoings: Are we covering our costs?
Incomings and Outgoings are shown together on the same graph so we can see how they vary from month to month. For an explanation of what is meant by "core" income and expenditure, see below. - Net Core Incomings: the temple's monthly cashflow on its core activities
This is a graph of "income minus expenditure" and shows whether the temple is covering its costs month by month.
- Net General Fund Income: overall cashflow month by month
This includes all our income and expenditure, and shows the amount that the temple would have each month for other purposes, such as making improvements to the property. - General Fund Net Current Assets: the temple's cash resources
This is what that the temple has available for it's day-to-day spending and paying bills. It goes up or down each month depending on whether there is an overall income or loss during that month. - Net Worth: the overall value of all the temple's resources
This is the overall value of what the temple owns, including the building and other fixed assets, as well funds in our bank account. - Building Fund (now closed)
This shows what the temple currently has in its Building Fund, which is a restricted fund for the purpose of buying a property to give the temple a long-term home.
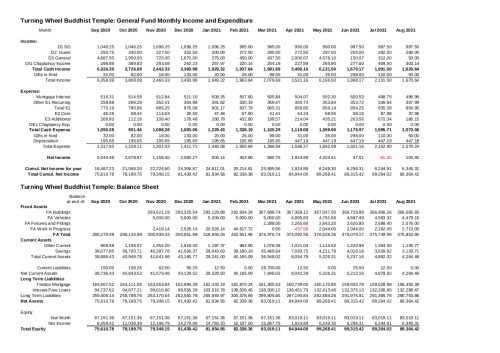
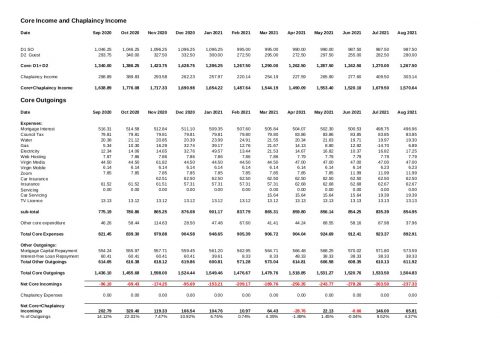
Following this are the numbers, for each of the last twelve months, that the graphs are based on:
- the Income and Expenditure and the Balance Sheet
- the Core Income and Core Expenditure
Finally, there is an explanation of how the figures are calculated, and what is meant by "core" incomings and outgoings.
What does it take to keep the temple going?
It costs about £850 per month to cover the basic bills, shown in the diagram (tapclick to enlarge).
At the moment we are receiving about £760 per month in regular donations by standing order.
This means that we would need an additional £90 per month from donations in the alms bowl to cover our costs.
Any help with covering these costs is greatly appreciated, either from donations in the alms bowl or from regular donations made by standing order. All donations are received with gratitude, and any surplus will help us to improve the facilities that the temple is able to offer. Thank you for your support.
Core Income
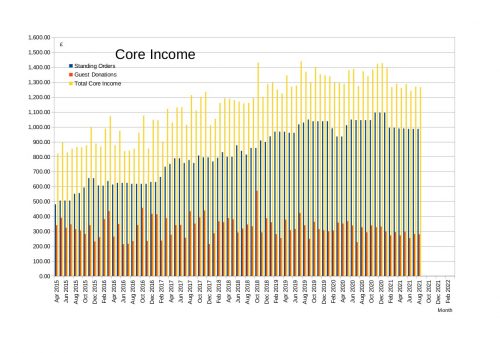
The temple's Core Income is the basis of its financial support, and is made up of standing orders and guest donations. These are shown in the following graph, which includes Core Income for each month since April 2015. The blue bars show regular income from standing order donations, the red bars represent donations placed in the temple alms bowl (guest donations), and the yellow bars are the sum of these two (tapclick the graph to enlarge it).
Due to the coronavirus restrictions, the temple was closed to visitors from mid-March 2020 until the end of August 2021, with all events during this period taking place online. As we have not had any events held in person at the temple, we have not received any Guest Donations in the alms bowl from visitors to events. However, a number of people have kindly dropped off donations at the temple, and others have made donations either online or by cheque, and as these are in lieu of putting donations in the alms bowl they have been included as Guest Donations. As a result, the income from Guest donations has been fairly steady over the lockdown period, although it has been gradually declining in recent months.
During the period that the temple has been closed a number of people have kindly increased their Standing Orders, or set up new ones, and at the beginning of 2021 these were at the highest level we have had. During the year a small number of people have had to cancel or reduce their standing orders, and these are now at a similar level to the first half of 2019.
Our total Core Income is also at a similar level to the first half of 2019, which is really very good considering that we haven't had any in-person events during this time.
Thank you to all those who are so generously supporting the temple through your standing orders, donations in the alms bowl, food donations and other donations in kind, in addition to the support of your practice.
Comparison of Core Incomings and Outgoings
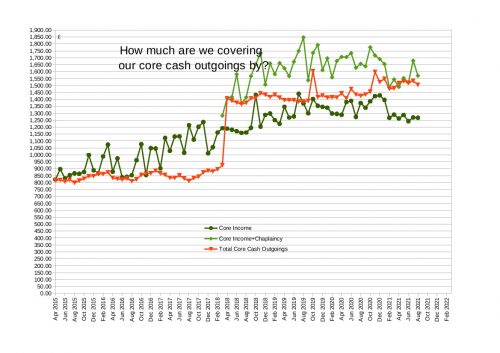
Plotting these Core Incomings together with the temple's Core Outgoings on the same graph shows how these compare - which is higher and how large is the difference. This is shown in the graph below (tapclick the graph to enlarge it).
Some of the temple's core expenses, particularly heating costs, vary quite considerably from month to month, and you can see that Core Outgoings (the red line) vary seasonally; higher in winter and lower in summer. They also increased significantly in April 2018 as we started making mortgage repayments. In November 2020 the temple bought a car, and the costs of insurance etc. for this have increased our core costs a bit further. Core Incomings (the dark green line) are much more variable, but are now generally below the outgoings each month.
In addition to our regular core income, however, the temple has an additional source of income, as Rev. Aiden acts as a Buddhist Chaplain for an organisation in Leicester, and the temple receives an income from this. The light green line shows these combined Core+Chaplaincy Incomings, and with this additional income the light green line has mostly been above the red Outgoings line each month. In recent months however, the two have been very close, with the red Outgoings line being higher on a couple of occasions, indicating that we didn't cover our costs in those months.
This graph really highlights the great variability that there is in the temple's cash incomings, as well as how narrow the margin can be in some months, when we are only just covering the outgoings.
For an explanation of what is meant by "core" incomings and outgoings, see below.
Net Core Incomings
Recent Cash Incomings and Outgoings
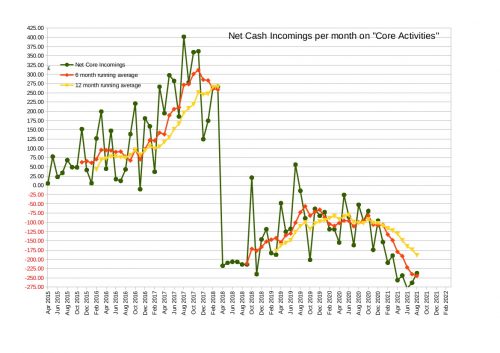
The difference between Incomings and Outgoings is shown directly on the following graphs, which show "net incomings", which is "cash incomings minus outgoings", for each month since April 2015. First of all without the chaplaincy income (tapclick to enlarge):
The "trend lines" show the running average over the previous 6 and 12 months, and help show the overall movement within the large month-to-month fluctuations.
This graph changed significantly in April 2018 when we started repaying the mortgage on the temple property. Since then we have generally not been covering our core monthly outgoings from our core income, and since Autumn 2020 the situation has steadily deteriorated, so that in recent months we have had a shortfall of well over £200.
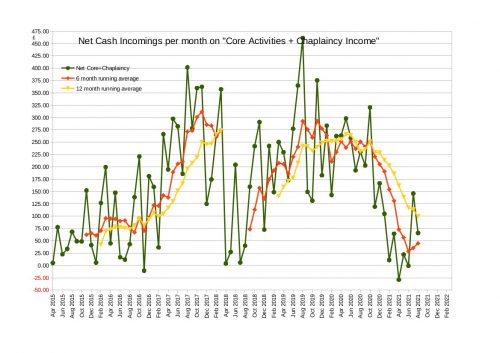
When the Chaplaincy income is included, the graph is as shown below (tapclick to enlarge):
As in the previous graph, the "trend lines" show the running average over the previous 6 and 12 months.
With this additional income the temple has generally covered its costs in recent years, although the yellow 12-month trend line has been falling consistently since October 2020, indicating that the situation is deteriorating. We didn't quite cover our costs in either April or June this year. July and August were significantly better than the previous few months, so that the red 6-month trend line has started to rise again, although it is still at a very low level.
NB The figures for incomings and outgoings are for cash incomings and outgoings, and don't include donations of food or other items.
Net General Fund Income
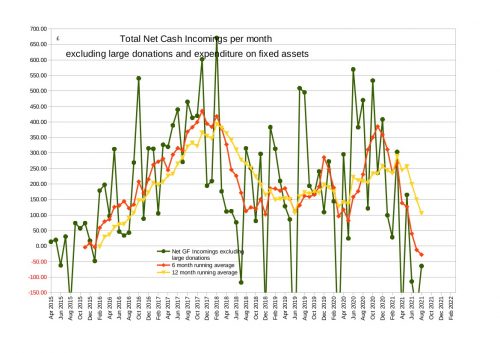
In addition to looking at the Net Core Cash Incomings, it is also important to look at the Net Total Cash Incomings to the General Fund, which also includes general donations received online or in the post, as well as spending that is in addition to the minimum that is needed to run the temple, such as on equipment and improvements to the building.
Any surplus on this is the amount which would be available to spend on maintaining and improving the property, for example. The following graph shows the overall net cash incomings for each month since April 2015 (tapclick to enlarge):
Again, the "trend lines" show the running average over the previous 6 and 12 months, and help show the overall movement within the large month-to-month fluctuations.
Again this graph shows a gradual deterioration over the last year or so. In recent months this has been due to expenditure on redecorating the temple building following the building work earlier in the year, which is important to do but will hopefully be temporary. Also, these additional expenditures are ones that we only make if the funds are available, and so we can reduce our spending if we can't afford it.
NB These figures include the value of food or other items donated as "Gifts in Kind". They do not include individual large donations, or expenditure on fixed assets, as these would skew the graph significantly, and the running averages would no longer be useful.
General Fund Net Assets: The Temple's financial resources
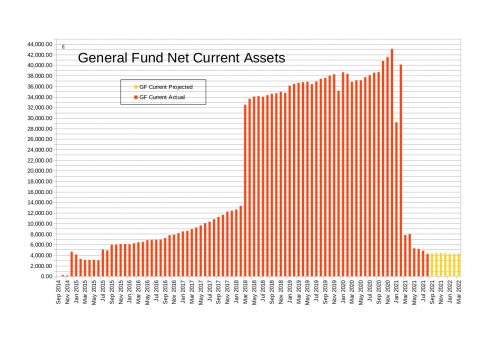
Another way of looking at the temple's financial position is to look at the resources that the temple has. Firstly, we can look at the cash that the temple has for day-to-day spending, paying bills etc., which is called the General Fund's Net Current Assets. Net Current Assets are broadly equal to the money that the charity has in its bank account minus what it owes on, for example, utility bills.
The value of these resources is shown in the following graph (tapclick to enlarge). Each bar represents the position at the end of a month. When there is an overall net income in a month the bar goes up, compared with the previous month, and when we have a deficit it goes down.
The red bars show the actual position in past months, and the yellow bars show a projection for future months. The significant increases between October and December 2020 were due to large donations and interest-free loans made to support the building project, which we are very grateful for. The sudden decrease between December 2020 and March 2021 was due to us paying for the building work that had been carried out over the winter. The balance rose temporarily in February when we received an additional loan which had been made to help support the work, before falling further as this was used to pay the final bills for the project.
Since then our cash reserves have continued to fall gradually, as there have been further items that we have needed to buy for the property, including carpets for our main rooms. The bulk of this spending has now been done, so we hope that our position will stabilise over the next few months, and perhaps grow as visitors return to the temple. It is still possible though that we may not quite cover our expenses during winter months, when our heating costs are higher.
We aim to maintain a reasonable cash balance, as this gives us a buffer to help weather any unforeseen expenses that the temple may have.
Some of the numbers that are used for the projections for future months are fairly certain, as we know what a lot of our bills will be in those months, and standing orders give some stability to our income. Other income and expenditure is more variable, and an estimate is used for these (more details below). The forecasts become less reliable the further into the future we try to project.
Net Worth: The Temple's financial resources
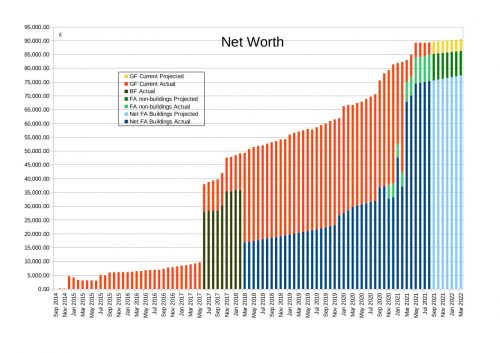
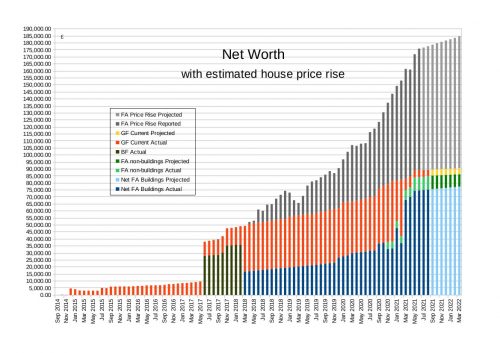
The temple's Net Worth (the overall financial resources of the temple) is equal to all of the temple's assets (the value of everything that it owns) minus all its liabilities (what it owes to others). The temple's main assets are the temple property and the funds it has in the bank. The main liabilities are the long-term loans used to buy the property.
In the following graph, each bar represents the Net Worth at the end of a month (tapclick to enlarge). The meaning of the red and yellow bars is as described for the previous graph, and the green and blue bars are described below.
The value of the temple property
As of the end of February 2018, the temple's assets mainly consisted of the Building Fund (green bars), plus funds in our bank account. It's main liabilities were the long-term loans we had received towards a property purchase.
In March 2018 the situation changed with the purchase of the temple property; the Building Fund was closed, and all savings are now held in the General Fund.
To help interpret the overall figure, the dark blue bars from March 2018 onwards show an amount equal to the purchase price of the property (approximately £299,800 including purchase costs) less all of the outstanding loans we received towards the purchase (initially £180,000 mortgage and £103,000 of interest-free loans). This is described as Net Fixed Assets, and when we bought the property in March 2018 this started out at just under £17,000. Although strictly speaking it is not possible to allocate liabilities against assets in this way, this helps give an indication of how much of the property the charity "owns". The value of the Net Fixed Assets increases each month, as we gradually pay off the loans, although this increase is reduced slightly by depreciation of the property.
Between December 2020 and March 2021 we had some significant building work done to the property, to improve the temple's facilities. We paid for this in instalments between January and March 2021, and as a result the red bars have reduced significantly as our bank balance decreased, whilst the blue bars have increased, representing the cost of the work that has been done. The further significant increases in April and May were due to two of our interest-free loans being forgiven by the lenders, which we are very grateful for. This decreased the total value of the loans we have, so increasing the Net Fixed Assets value of the building, as described above.
Other fixed assets
The green bars in the graph represent other fixed assets apart from the building, and include a car purchased in November 2020, replacement double-glazed windows for part of the property, and new carpets and vinyl flooring for the rooms that have been affected by the building work.
At the end of August 2021 the "Net Fixed Assets" value of the building stood at nearly £75,000, the value of non-building fixed assets was about £10,000 and the Net Worth was just under £90,000.
The light blue bars show a projection of how the Net Fixed Assets are expected to grow, as we gradually repay the outstanding loans. As long as we are able to keep up the mortgage repayments, this amount will continue to grow steadily. What we need to keep an eye on is the amount of savings we have (the Net Current Assets, see above), to make sure that we have the funds available to make repayments and meet other expenditures.
Net Worth taking into account house price rises
In our accounts we follow the standard accounting practice of depreciating the value of a building over a number of years. We use a commonly used period of 100 years, so that the value reduces by 1% per year. However, in practice the value of houses is increasing year-on-year, and including the price rise of our property would give a more realistic idea of the temple's Net Worth.
This is included in the following graph by increasing the value of the house each month by the percentage increase in the price of detached properties in Leicester, as given by the Land Registry UK House Price Index. In the year to March 2021 this would have given an increase of over 10.5%, rather than a decrease of 1%, and overall the property is probably worth about 25% more than when we bought it in March 2018. As before, each bar represents the Net Worth at the end of a month (tapclick to enlarge). The grey bars show the effects of this price rise, and the other bars are as described for the previous graph.
This clearly makes a big difference to the temple's Net Worth, increasing it from about £90,000 to £175,000. Caution needs to be taken with these figures however, as an average increase across a type of property may not apply exactly to the temple property, but it gives an indication of how prices may stand currently. (The percentage rises from July 2021 onwards are estimates, and values for previous months may be revised as the Land Registry receives more details of recent sales).
The numbers that the graphs are based on
Overall Income and Expenditure and Balance Sheet
(tapclick to enlarge)
Core Income and Expenditure
(tapclick to enlarge)
The Building Fund
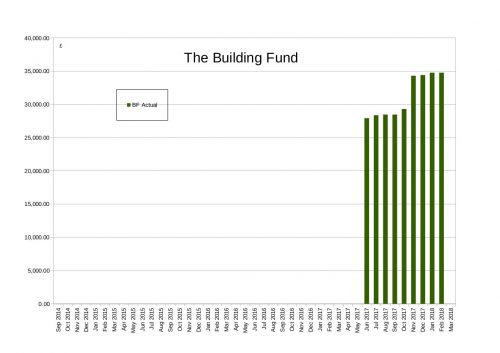
We launched the temple's Building Fund in late May 2017, and at the end of February 2018 the fund stood at just under £35,000. When we purchased the new temple property in March 2018, the costs of doing this were paid from the Building Fund, and the remaining balance was then transferred to the General Fund in order to complete the purchase. As a result, the balance on the fund reduced to zero, and the Building Fund has now been closed.
The history of the Building Fund is shown in the following graph (tapclick to enlarge). Each bar represents the position at the end of a month.
How the figures are calculated
Accruing outgoings on a monthly basis
The main reason for comparing incomings and outgoings month by month is to see whether the temple is covering its essential outgoings from the donations it receives. In order to do this we need to know what the incomings and outgoings are in each month. However, many of the temple's bills arrive at longer intervals than this - for example gas and electricity are invoiced quarterly and water twice a year. If these are only included in the month-to-month comparison when they are paid, then there will be some months with very high outgoings and others with very low outgoings, so that it won't be possible to see the underlying picture.
In order to compare months properly, we need to include in each month's outgoings the portion of those bills that relate to that month. This is called accruing the charges to each month. It can be done for gas, electricity and water by reading the meters at the beginning of each month, and calculating the usage charge and standing charge for the previous month using the rates that the utility companies charge. For other expenses such as insurance and council tax, the monthly amount is simply the yearly total divided by twelve.
Core Incomings and Outgoings
Even when we accrue outgoings to each month, there can still be significant differences between months. This is because in some months there are additional costs; for example buying items of equipment for the temple such as a cordless phone or a water heater, or hiring a van. These are one-off costs, and if they are included in the comparisons it will be very hard to see whether the temple is covering its basic ongoing costs. Similarly, the temple has received some very kind one-off donations, and including these in comparisons will also obscure the underlying picture. So to make the comparison easier it is helpful to consider each item of incomings and outgoings to be either "core" incomings and outgoings or "additional" incomings and outgoings.
"Core" Incomings and "Additional" Incomings
Core incomings include regular donations by standing order, and donations placed in the temple alms bowl (guest donations). Any other incomings are considered to be "additional" incomings, including large one-off donations, donations received in the post, and single online donations. It should be emphasised that these categories are simply to help the month-to-month comparisons give us useful information; all donations are very much appreciated, in whatever form they are received, and all help to support and sustain the temple and the resident monk.
"Core" Outgoings and "Additional" Outgoings
Core outgoings include mortgage interest payments and capital repayments, council tax and insurance, as well as utilies - gas, electricity, water, phone and internet. They also include food, household and other similar outgoings which are essential to the running of the temple. Additional outgoings are anything other than these, and can be regarded as "discretionary" in the sense that we will buy them if we can afford them, but if we can't, the temple can still function without them. Additional outgoings include purchasing items that would upgrade or improve the facilities that we can offer.
Gifts in Kind
The graphs of core incomings and outgoings that are presented are for cash incomings and outgoings only, and don't include donations of food or other items. "Gifts in Kind" are actually an important aspect of the support which the temple receives; food donations are often more than £100 worth per month, and donations of household items (such as cleaning products, toilet paper and soap) and items of equipment are also gratefully received. These donations are not included in the core incomings graphs, as it is the cash incomings and outgoings that we are focussing on there. However, they are included in the Overall Income and Expenditure and Balance Sheet numbers. Although they are included in the Net General Fund Income and Net Worth graphs, Gifts in Kind are accounted for as both an income and an expenditure (because, for example, food is donated, and then eaten), and so the values in these graphs are unchanged by their inclusion.In summary
Core incomings and outgoings are what we can expect to happen every month:
- incomings are from standing orders and guest donations
- outgoings are the minimum necessary to run the temple
Additional income and expenditure:
- incomings are any income other than from standing orders and guest donations
- outgoings are "discretionary" items
Estimates used in the Net Worth graph
The temple's financial resources increase or decrease each month according to the total income and expenditure. This is shown by the red bars in the Net Worth graph, which includes all income and expenditure during each month. This is the same value as shown on the Balance Sheet at the end of each month.
To give an idea of how the temple's resources are likely to change over coming months, the Net Worth graph also includes projections for future months (the yellow bars). The values that are used for the projections are as follows:
- Standing Orders: the value for the current month is used
- Guest donations: an average of guest donations for the same month of previous years (since April 2015) is used
- Other "additional" income is assumed to be zero
- Mortgage interest payments, council tax, insurance, phone and internet are known in advance: the actual figures are used
- Gas, electricity and water are estimated based on past usage, which varies seasonally
- Food, household etc.: an average of the previous six months is used
- Additional expenditure: an average of the previous six months is used


